
Volume divergence signals trouble when price and trading volume move in opposite directions. Price hits new highs while volume drops? That’s bearish divergence suggesting weakening buying interest. Price makes lower lows but volume shows higher lows? Bullish divergence indicates selling pressure is fading. Smart traders calculate this using rate of change formulas and visual chart analysis. They combine divergence with RSI or MACD indicators for confirmation before entering positions. Understanding these patterns reveals market sentiment shifts ahead of obvious price reversals.
Understanding Volume Divergence: Definition and Core Principles
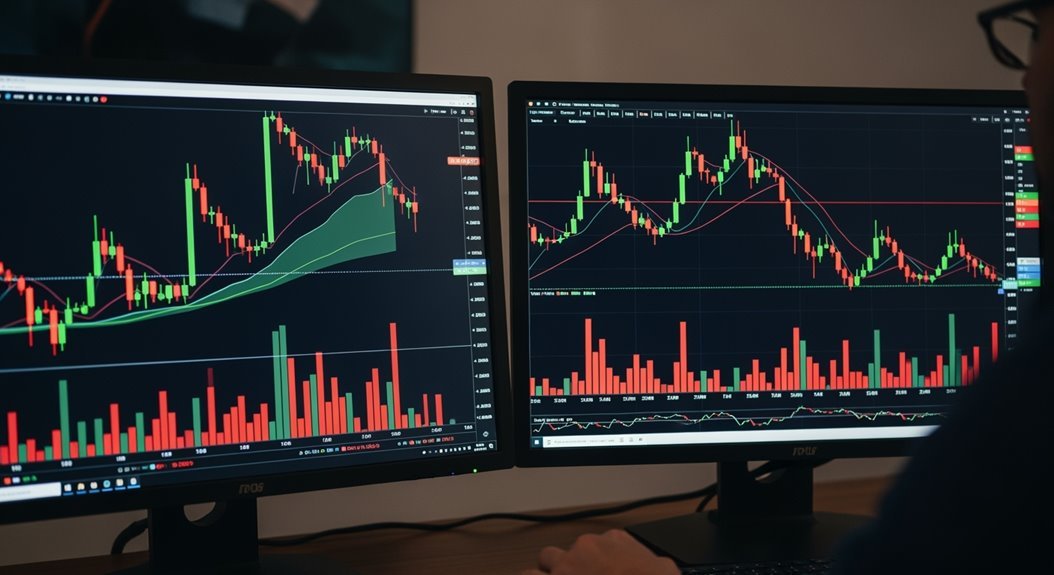
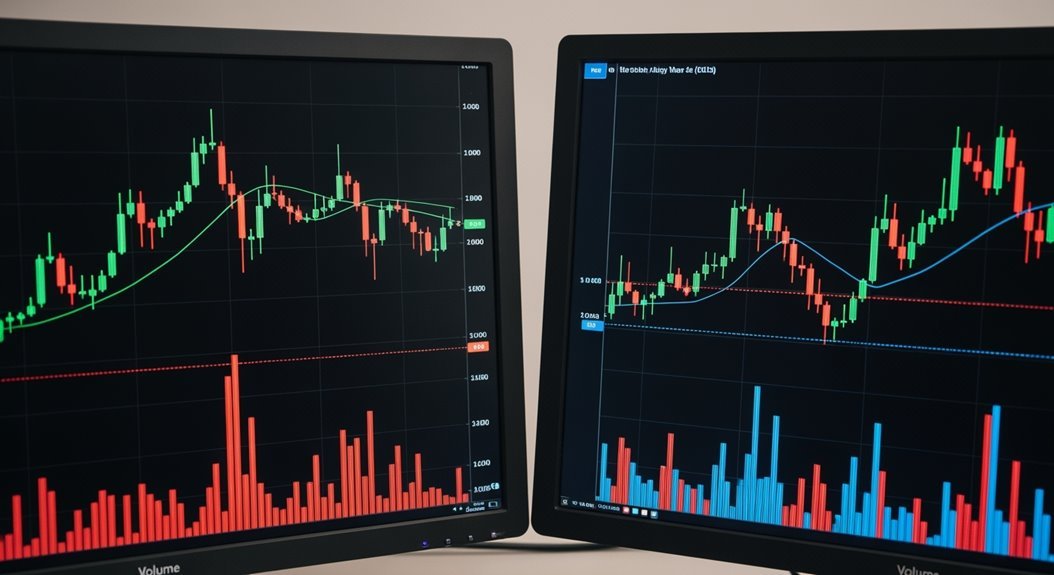
A price chart tells one story. Volume tells another. When these stories don’t match, traders call it volume divergence.
This phenomenon occurs when price movement and trading volume move in opposite directions. Price might hit new highs while volume drops. Or price falls but volume stays flat. Either way, it signals trouble.
When price and volume tell different stories, the market is preparing to change direction.
The core principle is simple: volume reflects market participation and conviction. Strong price moves need strong volume support. Without it, the trend lacks genuine momentum.
Volume divergence acts as an early warning system. It reveals weakening buyer enthusiasm during uptrends or weak selling pressure during downtrends. The insight? Volume usually precedes price changes.
This discrepancy suggests a potential shift in market trend or momentum. Smart traders watch for these signals because they often predict reversals before price action confirms them. The market shows its hand through volume first. Patterns across multiple price swings become especially significant when three or more peaks show the same divergence behavior. Major economic events can disrupt existing divergence patterns, making it crucial to consider external factors when analyzing these signals.
Traders can enhance their analysis by utilizing key volume indicators such as On-Balance Volume (OBV), RSI, and MACD to better spot these crucial divergence patterns.
Types of Volume Divergence: Bullish Vs Bearish Signals
Volume divergence comes in four distinct flavors. Each tells a different story about market momentum and trader behavior.
Regular bullish volume divergence signals reversals. Price hits lower lows while volume indicators like OBV form higher lows. This shows selling pressure weakening. Bears lose steam. Bulls quietly build strength. It’s a leading indicator that often precedes price rallies.
Regular bearish volume divergence works oppositely. Price makes higher highs but volume indicators drop to lower highs. Buying interest fades despite rising prices. The uptrend runs on fumes. A correction looms.
Hidden bullish divergence suggests trend continuation. Price drops but volume decreases too. Reduced selling volume hints at hidden buying pressure. The pullback may be temporary.
Hidden bearish divergence is trickier. Price climbs higher while volume patterns reveal underlying distribution. Smart money sells into strength. The uptrend continues but with growing weakness underneath. Traders should confirm these divergence signals with other technical indicators before entering positions.
Each type requires different trading strategies and risk management approaches.
Calculating and Identifying Volume Divergence on Charts
Spotting divergence on charts requires more than eyeballing volume bars and price action. Traders need systematic calculations to separate buying and selling volume effectively.
The math is straightforward. Buying volume equals total volume multiplied by the close-to-low distance divided by the high-low range. Selling volume uses the same formula but measures high-to-close distance instead. These calculations only work when high doesn’t equal low.
Rate of Change (ROC) adds another layer. It measures percentage changes in both volume and price over identical periods. The Volume/Price Divergence ratio—ROC volume divided by ROC price—quantifies divergence strength. Values above 10 signal major divergences. Numbers near 1 indicate synchronous movement.
Visual identification focuses on comparing volume at similar price points. Lower volume at new highs suggests bearish divergence. Rising volume at price lows indicates bullish signals. Higher trading volume allows for quicker order execution and enables traders to take positions with greater confidence in liquid markets. Volume bars provide market narrative showing whether institutions are accumulating or distributing shares at key price levels. Colored bars simplify analysis—green for buying volume, red for total volume. Modern volume divergence indicators provide non-repainting alerts that help traders avoid false signals from constantly changing pivot points.
Trading Strategies and Risk Management With Volume Divergence
Three distinct trading approaches leverage volume divergence signals to capture market reversals and momentum shifts. Swing traders adapt these strategies across different timeframes, while day traders exploit short-term discrepancies between price and volume patterns.
The most effective approach combines volume divergence with technical indicators like RSI and MACD. Rising prices with declining volume signal weakening momentum. Conversely, bullish divergence near price troughs with increasing volume indicates potential upward moves. A satisfactory profit factor of at least 1.75 indicates a viable divergence trading strategy. Maintaining a trading plan updated regularly helps traders refine volume divergence strategies and eliminate poor execution habits.
| Trading Strategy | Risk Management |
|---|---|
| Enter long positions during bullish volume divergence at price lows | Place stop-loss orders below key support levels |
| Short near price peaks with bearish volume divergence | Limit risk to predetermined percentage of capital |
| Combine with RSI/MACD for confirmation | Monitor trades continuously for pattern changes |
| Use volume bars as reference points | Size positions based on account size and volatility |
Traders must determine risk appetite before implementing volume divergence strategies. Position sizing prevents overexposure while stop-loss orders protect against unexpected moves. Confirmation signals such as trendline breaks or bearish candlestick patterns should validate the divergence before entering trades.
Frequently Asked Questions
How Does Volume Divergence Differ Across Forex, Stocks, and Cryptocurrency Markets?
Volume divergence reliability varies dramatically across markets. Stocks offer the most accurate signals due to centralized exchange data. Forex traders must rely on tick volume proxies, making divergence less dependable. Crypto markets present fragmented volume across exchanges, creating complex analysis requirements. Stock divergence integrates easily with technical indicators. Forex needs cautious interpretation. Crypto demands multi-source validation and blockchain metrics for confirmation.
Can Volume Divergence Be Automated Using Trading Bots or Algorithmic Strategies?
Volume divergence can absolutely be automated through trading bots and algorithmic strategies. Algorithms calculate volume-price divergence ratios by monitoring rate of change indicators. Bots flag divergence thresholds automatically—like VPD ratios exceeding 10 for strong signals. They identify bullish divergence when price drops while volume rises, and bearish divergence when price climbs but volume falls. However, implementation faces challenges including data synchronization issues and false positives from unrelated market events.
What Timeframes Work Best for Identifying Reliable Volume Divergence Signals?
Higher timeframes like daily and weekly charts provide the most reliable volume divergence signals. They cut through market noise and align with broader trends. Traders should start there, then confirm on 4-hour to 1-hour intermediates. Lower timeframes work for precise entries but generate false signals alone. The top-down approach—weekly to daily to hourly—improves win rates by roughly 27% according to studies.
How Do Market Makers and Institutional Trading Affect Volume Divergence Patterns?
Market makers and institutional traders greatly distort volume divergence patterns through strategic liquidity management. Market makers absorb excess selling during declines, creating bullish divergence signals. They may withhold liquidity during rallies, generating bearish patterns. Institutions execute large trades that cause dramatic volume spikes without corresponding price moves. Their stealth algorithms mask true supply-demand dynamics. Both groups create deceptive signals requiring additional confirmation indicators.
Should Volume Divergence Be Weighted Differently During Earnings Seasons or News Events?
Volume divergence requires different weighting during earnings and news events. These periods create artificial volume spikes that distort typical price-volume relationships. Studies show increased false signals during earnings quarters. Smart traders reduce divergence weighting when news dominates markets. The volume-price correlation weakens notably during major announcements. Multi-timeframe analysis becomes essential. Risk management tools help navigate these distorted signals effectively.
Conclusion
Volume divergence reveals market weakness before price catches up. Smart traders watch for these warning signals. When price makes new highs but volume drops, selling pressure builds underneath. The opposite signals potential reversals too. Charts don’t lie about trader conviction. Volume tells the real story behind price moves. Master this concept and spot trend changes early. Risk management remains essential though. No indicator works perfectly. Combine volume divergence with other tools for better results.