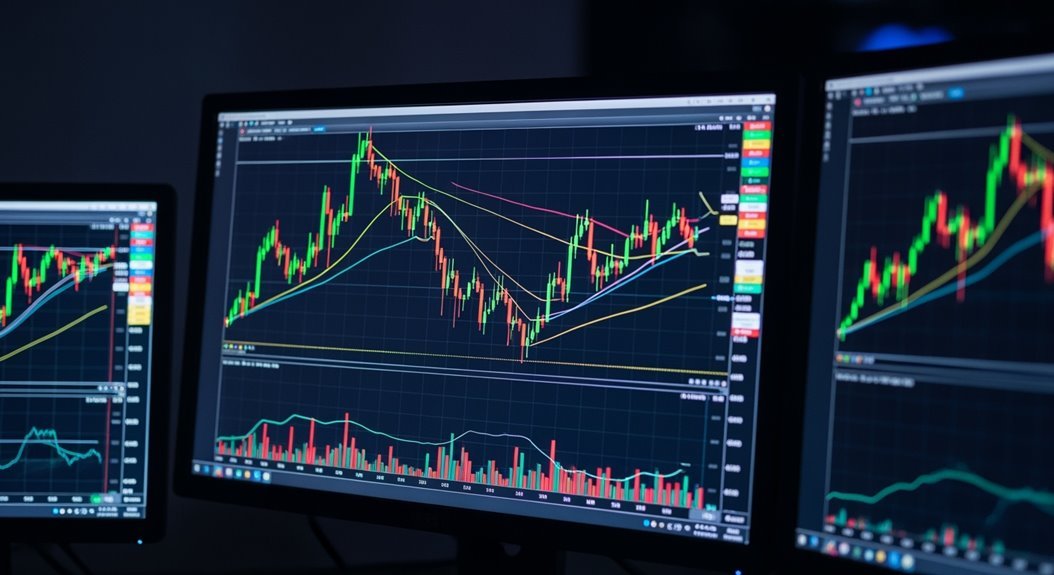
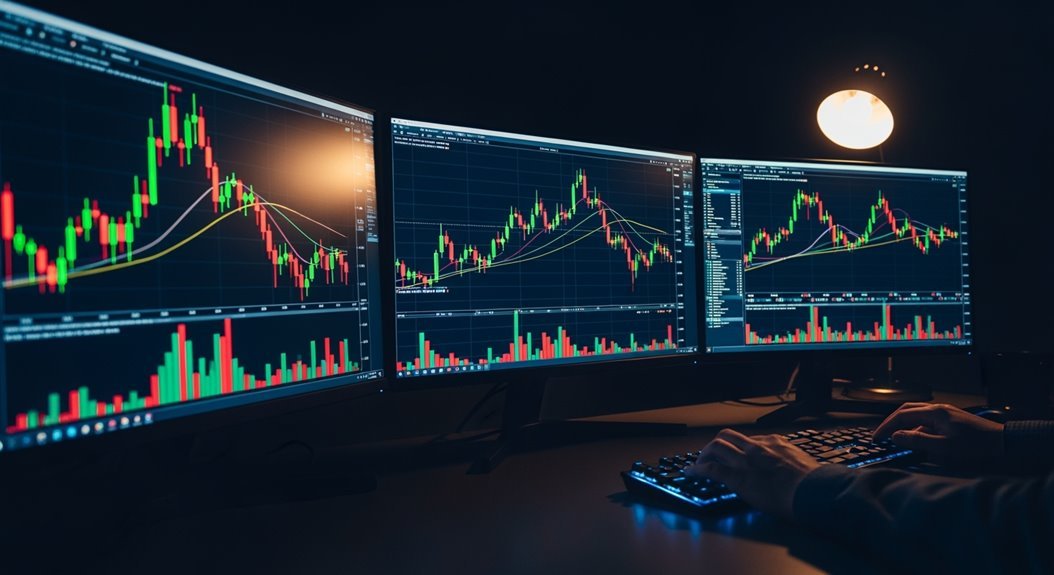
Day trading beginners should start with candlestick charts on 5-minute timeframes to balance clarity with actionable data. Candlesticks reveal price ranges and market psychology through bodies and wicks, making pattern recognition easier than basic line charts. Key patterns include triangles, double tops, and engulfing formations that signal trend changes. Essential indicators like moving averages, RSI, and volume confirm trading signals. Successful traders combine multiple chart types and timeframes—using 1-hour for trend direction and 15-minute for precise entry timing. Mastering these fundamentals opens advanced trading strategies.
Chart Types and Their Applications

Three primary chart types dominate day trading platforms, each serving distinct purposes in market analysis. Bar charts display thorough price data through vertical lines showing high, low, open, and close values. Green bars signal price increases. Red bars indicate decreases. The left tick marks opening prices, while right ticks show closing levels.
Line charts offer simplicity by connecting closing prices across periods. They provide quick trend assessment but lack vital intraday details. Traders often use them for initial overviews before switching to more detailed formats.
Candlestick charts reign supreme for day trading. They combine bodies and wicks to show price ranges and market psychology. Colors and shapes reveal bullish or bearish sentiment instantly. These charts enable pattern recognition like hammers and engulfing formations. Traders can practice pattern recognition skills through demo accounts before transitioning to live trading environments. The wicks extend from the bodies to display the highest and lowest prices reached during each trading period.
Each type has limitations. Bar charts can overwhelm beginners. Line charts miss granular data. Candlesticks require skill to interpret correctly. Most successful traders combine multiple chart types for thorough market analysis. Choosing the right timeframe is essential for effective analysis when using any chart type.
Selecting the Right Time Frames for Your Trading Strategy
Time frame selection makes or breaks day trading success. The choice hinges on trading style, risk tolerance, and how fast you want to move.
Scalpers live on 1-minute and 5-minute charts. Quick in, quick out. Small profits add up fast. But it’s noisy. Lots of false signals.
Swing traders prefer 15-minute to 1-hour charts. Cleaner trends. Fewer fake-outs. More breathing room.
Risk-averse traders stick to longer frames. Less volatility. More reliable signals. Fewer opportunities though.
The 5-minute chart hits the sweet spot for beginners. Good detail without overwhelming noise. Manageable pace.
The 5-minute timeframe balances clarity with action. Perfect for new traders learning the ropes without information overload.
Smart traders use multiple time frames. Check the 1-hour for overall trend direction. Then drop to 15-minute for entry timing. Finally, use 5-minute for precise execution.
Each frame serves a purpose. Backtesting your chosen time frame against historical data reveals which combinations actually work. Shorter frames mean faster execution requirements. Longer frames reduce stress but limit trades. Candlestick charts reveal essential price information including opening, closing, high, and low values across your selected time frame. Your entry and exit timing becomes optimized when the time frame aligns with your trading strategy. Match your frame to your strategy, not the other way around.
Recognizing Essential Chart Patterns and Candlestick Formations
Chart patterns and candlestick formations serve as the visual language of price action, revealing market psychology in real-time. Triangular patterns dominate day trading screens. Symmetrical triangles show converging trend lines with equal slopes. Ascending triangles feature higher lows against horizontal resistance—typically bullish. Descending triangles display flat support with declining highs—bearish warning signs.
Double tops and bottoms mark critical reversal zones. Two similar peaks signal resistance. Two comparable lows indicate support.
Candlestick patterns tell different stories. Engulfing patterns show momentum shifts when one candle completely absorbs the previous one. Hammers and hanging men display small bodies with long lower shadows. Location matters. Hammers after downtrends suggest bullish reversals. Hanging men after uptrends warn of bearish turns.
Morning and evening stars require three candles each. They signal strong trend reversals. Doji candles reveal market indecision with opens and closes at nearly identical prices. Flag patterns represent brief consolidation phases before the existing trend continues. Marubozu patterns feature wide-range candles with no shadows, indicating exceptionally strong buying or selling pressure.
Volume confirmation strengthens all patterns considerably. Head and shoulders patterns form three distinct highs where the central peak exceeds both flanking shoulders, creating a reliable bearish reversal signal.
Using Technical Indicators to Confirm Trading Signals

While chart patterns reveal market psychology, technical indicators provide the mathematical backbone that separates educated trades from expensive guesses. Day traders rely on two main categories: overlays and oscillators.
Overlays like moving averages sit directly on price charts. The Golden Cross—when the 50-day moving average crosses above the 200-day—signals bullish momentum. Its opposite, the Death Cross, warns of bearish trends ahead.
Oscillators fluctuate within set ranges. RSI readings above 70 scream “overbought.” Below 30? Oversold territory. MACD crossovers pinpoint momentum shifts before they become obvious.
Volume indicators separate real moves from fake-outs. On-Balance Volume confirms whether buying pressure supports price increases. Without volume backing a breakout, traders should stay skeptical. The Accumulation/Distribution Line measures money flow by considering where prices close relative to their daily trading range.
Bollinger Bands measure volatility. Prices hitting outer bands often signal reversals or breakouts brewing. Research shows that RSI and Bollinger Bands demonstrate exceptional reliability with consistently high win rates in long-term backtesting studies. Modern traders benefit from platforms that provide real-time tracking of signals to ensure timely notifications for entry and exit decisions.
Smart traders never rely on single indicators. Combining RSI with MACD, or volume with moving averages, builds confidence. Multiple confirmations reduce costly mistakes.
Frequently Asked Questions
What Are the Best Free Charting Platforms for Beginner Day Traders?
TradingView tops the list for free charting. Its basic tier offers powerful technical analysis tools. ProRealTime Web provides unlimited indicators and layouts without ads. Webull combines zero-commission trading with advanced charts and free Level 2 data. Robinhood works for simple analysis but lacks depth. Fidelity earns recognition for beginner-friendly features. TradingView remains the gold standard for dedicated charting software.
How Much Capital Do I Need to Start Day Trading Effectively?
Day trading capital requirements vary dramatically by market. Forex needs just $500 practically. Stocks and futures demand $25,000 for pattern day traders under FINRA rules. Options require $5,000-$10,000 minimum. A general formula suggests daily profit goals times ten equals minimum account size. Most experts recommend $3,000-$10,000 starting capital. This provides adequate cushion for losses, transaction fees, and effective stop-loss usage without emotional pressure.
What Are the Most Common Mistakes Beginners Make When Reading Charts?
Beginners consistently overload charts with too many indicators, creating confusion and conflicting signals. They misread candlestick patterns and ignore volume confirmation. Poor risk management dominates—no stop losses, oversized positions, averaging down on losers. Emotional trading runs rampant. Fear and greed override strategy. They chase breakouts without context, ignore higher timeframes, and overlook stock liquidity. Most critically, beginners abandon proven setups after minor losses, constantly switching strategies instead of developing discipline.
How Do I Practice Chart Reading Without Risking Real Money?
Beginners can practice chart reading risk-free through trading simulators and demo accounts. Most brokers offer free demos with real-time market data. These platforms allow pattern recognition practice—triangles, flags, candlesticks—across different timeframes. Historical playback tools let traders rewind and replay past market data. Video tutorials provide structured learning. Demo accounts build confidence in chart interpretation and order execution before committing real funds.
What Market Hours Are Best for Day Trading Different Asset Classes?
Stock markets perform best during 9:30 AM-4:00 PM ET, with peak volatility at open and close. Forex traders target London-New York overlap (8:00 AM-12:00 PM ET) for maximum volume. Commodities spike around financial market openings and economic releases, especially 8:30-9:30 AM ET. Futures mirror stock market hours for ideal liquidity. Each asset class offers distinct timing advantages based on global trading sessions and institutional activity patterns.


