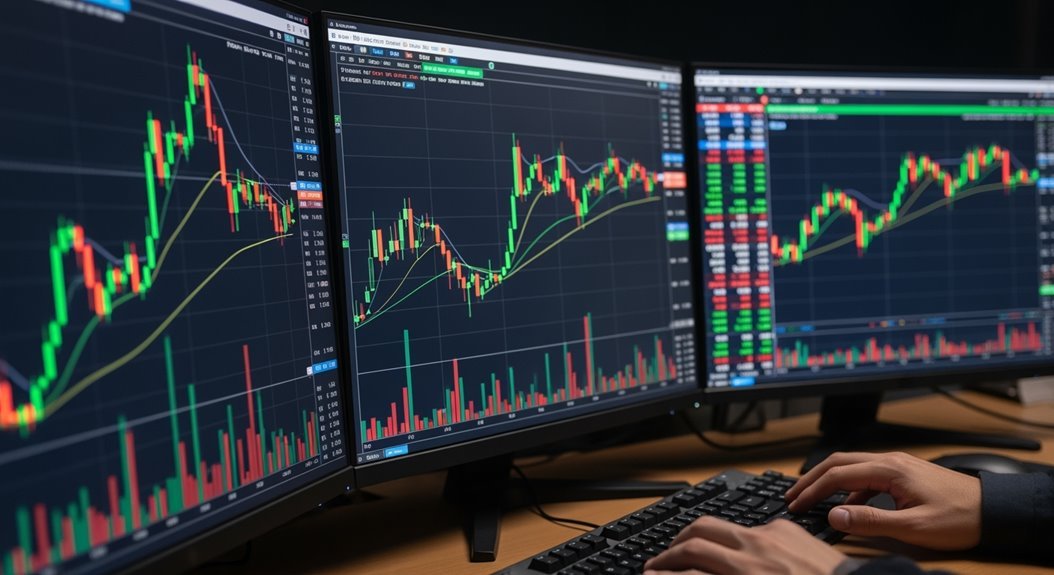
Order flow trading analyzes real-time buy and sell orders to identify market imbalances and predict immediate price movements. Traders use tools like Depth of Market windows, footprint charts, and volume profiles to spot supply-demand mismatches rather than relying on traditional chart patterns. Key strategies include detecting absorption patterns, exhaustion signals, and institutional iceberg orders that create hidden liquidity pools. This reactionary approach offers better trade timing and market transparency, though it requires significant technical knowledge and emotional discipline to navigate the data complexity effectively.
Understanding Order Flow Trading Fundamentals

Most traders rely on charts and indicators to predict price movements, but order flow trading takes a different approach entirely. This strategy analyzes the actual stream of buy and sell orders hitting the market in real-time.
Order flow focuses on executed trades and limit orders waiting at various price levels. The goal? Understanding market imbalances by watching how aggressive buyers and sellers interact.
Order flow reveals market imbalances through real-time analysis of aggressive buyer and seller interactions at various price levels.
Key components include bid prices, ask prices, and the spread between them. The bid represents the highest price buyers will pay. The ask shows the lowest price sellers accept. This spread reflects market liquidity.
Traders examine who’s dominating—buyers or sellers—and their pressure on price action. Market orders are aggressive, executing immediately at available prices. Limit orders wait passively at specific levels.
The Depth of Market window displays order quantities at different prices. Large passive orders can act as blockers that prevent significant breakout movements from occurring. This real-time data reveals which side controls momentum, offering insights traditional charts miss. Order flow trading emphasizes a reactionary approach rather than attempting to predict future market movements. Order flow strategies prove most effective in markets with a central exchange, such as stocks, commodities, and cryptocurrencies.
Essential Tools and Indicators for Order Flow Analysis
The right tools make all the difference in order flow trading. Five key indicators dominate this space.
Depth of Market displays all visible buy and sell orders awaiting execution. Traders see real-time interactions between market and limit orders. It reveals supply and demand imbalances at specific price levels. But interpreting complex bidding patterns requires advanced understanding.
Footprint charts visualize volume traded at each price level within candlesticks. They show bid volume, ask volume, and volume delta. Cumulative delta tracks net buying or selling pressure throughout the day.
Volume Profile distributes trading volume across price levels for specified time ranges. It highlights Point of Control and Value Area High/Low zones. Low volume nodes indicate breakout potential due to insufficient liquidity at those price levels. Volume Profile combines data from different trading sessions to identify key entry levels.
VWAP computes price averages weighted by volume. Institutional traders use it for intraday decisions. Deviation bands indicate anticipated pressure and help confirm trends during price breakouts.
Order Flow Imbalance quantifies net buying or selling interest. Volume Imbalance measures real-time differences between buy and sell orders. These tools identify market turning points before price changes appear.
Core Order Flow Trading Strategies and Market Applications
When large market participants begin absorbing incoming orders without moving price, savvy traders recognize the telltale signs of absorption patterns. Steady bid-ask spreads persist despite heavy volume. Large limit orders anchor price levels.
Exhaustion signals flash when accelerated volume meets diminishing price movement. Sequential stops trigger. Order book depth thins. Climactic volume spikes hit extreme prices.
Breakout detection relies on aggressive orders overpowering passive ones at key levels. Higher highs and lows confirm uptrends. Lower patterns indicate downtrends. The balance between market and limit orders reveals momentum strength.
Order flow charts expose buyer-seller imbalances at each price level. Institutional iceberg orders create hidden liquidity pools. Support and resistance clusters form where large volumes concentrate. TPO charts provide a graphical representation of how price develops across different trading sessions.
Stop runs create prime opportunities. Price hunts clustered stop-losses, triggering liquidity spikes. Institutional players exploit these moments. Trapped traders get forced out, then often re-enter. Smart traders position themselves to capture these momentum swings.
Benefits, Limitations, and Risk Management Considerations

Although order flow trading offers compelling advantages over traditional technical analysis, traders must weigh its substantial benefits against notable limitations and complex risk considerations.
Order flow trading delivers enhanced market transparency. It reveals actual trades and orders beyond surface-level charts. Traders gain improved predictive power by monitoring real-time buy and sell activity. This translates to better trade timing and superior risk control through immediate identification of supply and demand zones.
Order flow trading cuts through chart noise to reveal the true market story happening beneath price action.
But complexity creates barriers. Beginners face steep learning curves. Data overload overwhelms many traders. False signals emerge from market noise and order cancellations. Technology costs mount quickly. Similar to how trading blocs impact market dynamics through eliminating barriers, order flow trading removes information barriers for more integrated market understanding.
Effective risk management proves critical. Cross-verification prevents trading on incomplete data. Predefined risk limits contain losses. Emotional discipline becomes essential with real-time information flooding screens. Order flow analysis enables traders to identify scalping opportunities by recognizing short-term market movements as they develop. Utilizing heat maps provides visual interpretation of market conditions to spot trading opportunities more efficiently. Footprint charts serve as crucial visualization tools for displaying market order activity across different price levels.
The payoff? Smarter risk choices. Reduced psychological stress. Flexibility to adjust exposure dynamically. Early exit signals when momentum shifts.
Success demands proper implementation and realistic expectations.
Frequently Asked Questions
What Minimum Capital Is Required to Start Order Flow Trading Effectively?
Order flow trading capital requirements vary considerably by instrument and broker. Most traders need $2,000 to $25,000 minimum to start effectively. U.S. day traders must maintain $25,000 for PDT compliance. Futures trading requires thousands for initial margin alone. Position sizing should limit risk to 1-2% per trade. Beginners need several thousand dollars for realistic market exposure and proper risk management.
Which Brokers and Trading Platforms Offer the Best Order Flow Data Feeds?
Jigsaw Trading leads broker integration, connecting directly with Tradovate, Interactive Brokers, TD Ameritrade, and GAIN brokers. ATAS pairs well with AMP Futures for professional-grade feeds. Bookmap offers superior heatmap visualization through multiple broker partnerships. NinjaTrader provides solid order flow data via its own feeds plus broker connections. Quantower delivers multi-asset compatibility. TradingView works best for retail options flow but relies on aggregated exchange data rather than direct feeds.
How Do Market Makers and Institutional Traders Impact Retail Order Flow Analysis?
Market makers and institutional traders greatly distort retail order flow analysis. They use hidden liquidity and iceberg orders, masking true supply-demand signals. Institutions split large orders into smaller pieces, creating false volume patterns. Market makers constantly adjust inventory, introducing noise into order book data. Payment for Order Flow further segments retail orders away from visible markets. These factors make genuine retail sentiment harder to identify.
What Are the Typical Commission Costs Associated With High-Frequency Order Flow Strategies?
High-frequency traders face exchange fees around $0.30 per 100 shares when executing against standing orders. S&P 500 futures cost as low as $0.49 per contract for high-volume firms. The trick? Liquidity rebates offset removal fees. Professional HFT firms negotiate direct exchange access, bypassing retail broker commissions entirely. Micro contracts offer lower fees at $0.05 each. These razor-thin margins make fee efficiency absolutely critical for profitability.
How Does Order Flow Trading Performance Differ Across Various Asset Classes?
Order flow trading performance varies dramatically across markets. Equities deliver consistent results thanks to deep liquidity and transparent order books. Futures excel during volatile trends when momentum creates exploitable patterns. Forex faces challenges from fragmented liquidity but works well on major pairs. Crypto offers high returns but carries extreme risk from manipulation and volatility. Fixed income lags due to opaque, slow-moving OTC markets with limited electronic transparency.


