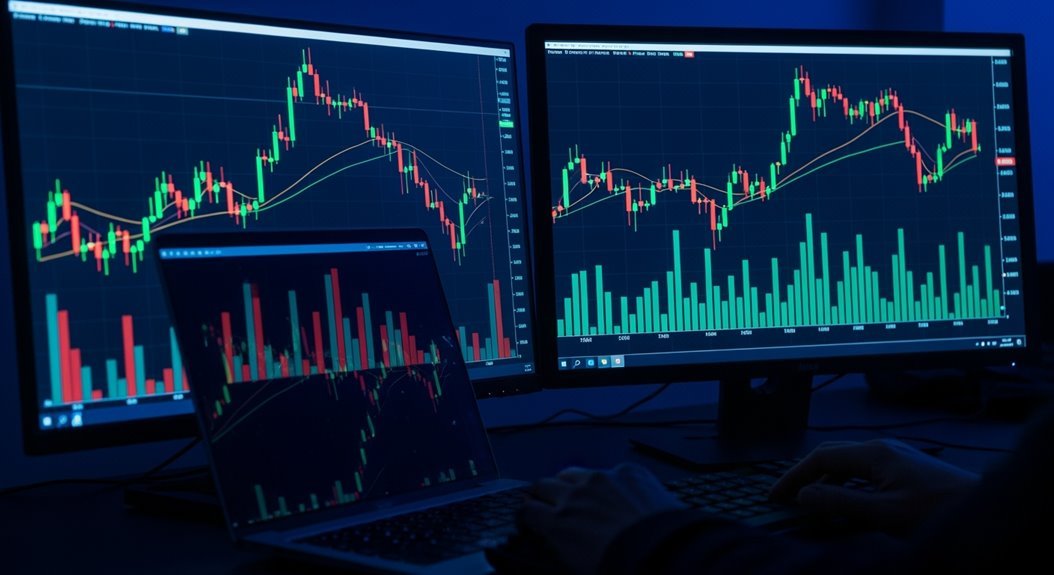
Volume divergence occurs when price movements fail to align with corresponding volume trends, creating a disconnect that signals potential weakness in the current price direction. Bullish divergence happens when prices hit lower lows while volume increases, suggesting possible trend reversal. Bearish divergence occurs when prices reach higher highs with decreasing volume, indicating a weakening uptrend. Traders use VPD ratios above 10 to identify strong conflicts between price and volume patterns, though false signals remain common in choppy markets and effective risk management proves essential for successful implementation.
Understanding Volume Divergence and Its Core Mechanics

Contradictions in the market reveal themselves through volume divergence, a phenomenon that occurs when price movements and trading volume head in opposite directions. This divergence signals potential shifts in market momentum before they become obvious.
Two types exist. Bullish volume divergence happens when prices hit lower lows while volume increases. This suggests the downtrend is weakening. A reversal may follow. Bearish volume divergence occurs when prices reach higher highs but volume drops. The uptrend lacks conviction.
The mechanics involve analyzing volume composition. Traders decompose total volume into buying and selling pressure based on price position within the period’s range. Rate of Change calculations for both price and volume create divergence ratios. Ratios above 10 indicate strong conflict between price and volume. Stop-loss orders should be implemented to protect against false signals when ratios appear unusually high.
Visual indicators plot these metrics with reference lines. This helps traders spot divergence quickly. The key principle remains simple: strong price moves need volume confirmation. Without it, the trend may be exhausted. Volume analysis provides insights into market liquidity levels which help determine the strength of current trends. Volume divergence analysis proves especially valuable in cryptocurrency markets due to their high volatility and frequent sentiment-driven price swings.
Identifying and Measuring Volume Divergence Patterns
Spotting volume divergence requires systematic analysis beyond surface-level observation. Traders need at least three consecutive price peaks with corresponding volume data to confirm genuine patterns rather than market noise.
The mathematical approach involves specific calculations:
| Metric | Formula | Purpose |
|---|---|---|
| Buy Volume | volume × (close − low) / (high − low) | Measures buying pressure |
| VPD Ratio | ROC of volume / ROC of price | Quantifies divergence strength |
| Rate of Change | (Current – Previous) / Previous × 100 | Compares relative movement |
VPD ratios above 10 signal strong divergence. Around 1 means synchronization.
Visual confirmation comes through trendlines. Ascending price lines paired with descending volume lines reveal bearish divergence. The opposite indicates bullish patterns.
VWAP provides additional verification when price struggles above it while volume declines. Trading platforms like TradingView offer oscillator tools that overlay price and volume data efficiently. Multiple timeframe analysis strengthens signal reliability considerably. Volume indicators like On-Balance Volume help fine-tune divergence strategies by confirming the directional strength of price movements. Effective risk management requires maintaining exposure between 1-2% per trade when acting on volume divergence signals.
Decreasing volume during price increases may signal possible distribution events where institutional traders are reducing their positions despite bullish price action.
Trading Strategies and Practical Applications
Most traders discover that volume divergence signals work best when woven into broader trading frameworks rather than used in isolation. Smart money combines these patterns with chart formations like head and shoulders or double tops. The result? More reliable reversal signals.
Entry timing matters. Bullish divergence appears when prices drop but volume climbs, suggesting accumulation. Traders enter long positions near these troughs. Bearish divergence shows the opposite—rising prices with declining volume signals weakness. Short positions work best at these peaks.
Technical indicators strengthen the approach. On-Balance Volume highlights divergences clearly. RSI and MACD provide secondary confirmation through overbought or oversold readings. Exponential moving averages track trend strength. Multiple time frames analysis, incorporating 5-minute, 15-minute, and 1-hour charts, enhances the accuracy of volume divergence detection. Traders must avoid false signals without proper confirmation to prevent costly mistakes in their volume divergence strategies.
Risk management adapts accordingly. Trailing stops use 21-period EMAs or ATR multiples—typically 2x or 3x below highs. Fibonacci retracements, especially the 61.8% level, guide profit targets. Volume surges confirm entries before committing capital. Partial scaling optimizes gains while reducing exposure.
Limitations and Risk Management Considerations

While volume divergence offers valuable insights into market momentum, traders face significant challenges that can undermine even the most carefully planned strategies.
False signals plague volume divergence, particularly in choppy markets. Divergences can persist for extended periods without triggering actual reversals. This creates premature entries and unprofitable trades.
Divergence patterns can mislead traders for weeks, creating costly false entries before markets inevitably continue their original trajectory.
Timing presents another hurdle. Divergence signals indicate weakening momentum but don’t predict exact reversal timing. Volume indicators lag because they rely on past data. Acting too early causes losses when markets continue their original direction.
Interpretation remains highly subjective. Different analysts may view identical divergence patterns differently. No standard exists for defining meaningful divergence thresholds. Traders must distinguish between normal market noise and true divergence patterns to avoid confusion that leads to inaccurate trading decisions. High trading volume typically indicates stronger market conviction and more reliable signals than low-volume patterns.
Market events compound these problems. News announcements and economic shifts can disrupt expected patterns entirely. Similar to how scheduled events like quarterly dividends from companies such as Altria can temporarily affect trading volumes and price action. Multi-timeframe analysis can help filter out noise and improve signal reliability.
Smart risk management becomes essential. Position sizing should limit exposure to 1-2% of capital per trade. Stop-loss orders based on volatility measures help control downside risk. Combining divergence with confirmation indicators reduces false signal exposure.
Frequently Asked Questions
How Does Volume Divergence Differ From Price Divergence With Oscillators?
Volume divergence tracks trading activity against price movements, revealing trader conviction levels. Price divergence with oscillators compares price action to momentum indicators like RSI or MACD. Volume divergence uses actual participation data. Oscillators rely solely on price calculations. Volume shifts often signal changes before oscillator divergences appear. Volume shows commitment intensity. Oscillators reveal momentum exhaustion. Both complement each other for stronger trading signals.
Which Timeframes Work Best for Detecting Reliable Volume Divergence Signals?
Higher timeframes like daily and weekly charts deliver the most reliable volume divergence signals. They filter out market noise and capture significant sentiment shifts. Studies show 27% better win rates using these timeframes. Four-hour charts work well for confirmation and timing. Lower timeframes like 1-hour and 15-minute are useful for precise entries but generate more false signals. A multi-timeframe approach starting with daily analysis provides excellent results.
Can Volume Divergence Be Used Effectively in Premarket and After-Hours Trading?
Volume divergence can work in premarket and after-hours sessions, but with major caveats. Lower volume makes signals less reliable and more prone to false readings. Thin liquidity creates noise. However, divergence patterns during these sessions often preview next-day action, especially around earnings or news events. Traders need additional confirmation from other indicators. Risk management becomes critical due to wider spreads and erratic price behavior.
What Volume Divergence Settings Should Beginners Start With When Learning?
Beginners should start with daily or 4-hour charts to avoid noise. Simple indicators work best—On-Balance Volume (OBV) paired with RSI or MACD for confirmation. Set volume smoothing periods between 10-20 bars. Use ATR-based stops around 1-2% for risk management. Focus on liquid stocks initially. Always confirm signals across two timeframes before acting. Practice with backtesting platforms first. Keep it simple—complexity kills beginner success rates.
How Do Market Makers and Institutional Trading Affect Volume Divergence Patterns?
Market makers manipulate volume patterns through continuous buying and selling, creating artificial spikes that mask genuine sentiment. Their inventory management distorts divergence signals. Institutions fragment large orders across venues, generating volume surges without immediate price movement. This creates accumulation or distribution phases before trend shifts. Both players layer trades to hide intent. Traders need multi-timeframe analysis and additional indicators like OBV or RSI to filter this institutional noise.
Conclusion
Volume divergence remains a valuable technical analysis tool for traders seeking market reversal signals. Smart traders combine volume patterns with price action and other indicators rather than relying on divergence alone. The method works best in trending markets with clear volume data. Risk management stays essential since false signals occur frequently. Traders who understand the limitations while applying proper confirmation techniques can leverage volume divergence effectively within broader trading strategies.


